Data Skills

Power BI Data Analytics for Professionals

At the end of this program, learners shall be able to demonstrate practical understanding of Excel for data management and Power BI for creating meaningful visualisations to drive business insights. The focus is on practical skills and their application in a business context. Participants gain practical experience through real-world case studies and projects, guided by industry experts, and receive certification upon completion, enhancing their professional profiles.

Power BI Data Analytics for Professionals Read More »

Getting Started with Python for Data Analysis — DAELites Masterclass

📌Why should I learn Python as a Data Analyst? 📌Is Python for Data Analysis a prerequisite for my Career Advancement? 📌How do I get started with Python for Data Analysis? Join our facilitator Mr.Tomisin Olatoye on the 23rd July 2024 as he unveils the foundation of Python for Data Analysis. The Python Masterclass for Data

Getting Started with Python for Data Analysis — DAELites Masterclass Read More »

End to End Demo with Microsoft Fabric — DAELites Masterclass

𝗪𝗵𝗮𝘁 𝗶𝘀 𝗠𝗶𝗰𝗿𝗼𝘀𝗼𝗳𝘁 𝗙𝗮𝗯𝗿𝗶𝗰? Microsoft Fabric is an all-in-one analytics platform designed to streamline the end-to-end analytics experience. It integrates a variety of data and analytics services into a single unified platform, simplifying the process of collecting, storing, analyzing, and visualizing data across organizations. Microsoft Fabric is built on top of the Microsoft Azure cloud infrastructure, and it provides tools for data integration, data engineering, data science, real-time analytics, and business intelligence

End to End Demo with Microsoft Fabric — DAELites Masterclass Read More »

Understanding the Dynamics of Tableau — DAELites Masterclass

What is TABLEAU? Tableau is a powerful data visualization and business intelligence tool that helps users analyze, visualize, and share data insights. It allows users to create interactive and shareable dashboards that depict trends, variations, and density of data in the form of graphs and charts. With its user-friendly drag-and-drop interface, Tableau can handle large

Understanding the Dynamics of Tableau — DAELites Masterclass Read More »

Python For Intermediates Data Analytics — DAElites – The Python Academy

Become proficient in Tableau with this course designed to teach you the art of data visualization. Learn to create dynamic dashboards, apply best practices in data visualization, and communicate data insights effectively. By the end, you’ll be able to build and share impactful visualizations that tell a compelling data story. 6 weeks intensive training FREE

Python For Intermediates Data Analytics — DAElites – The Python Academy Read More »

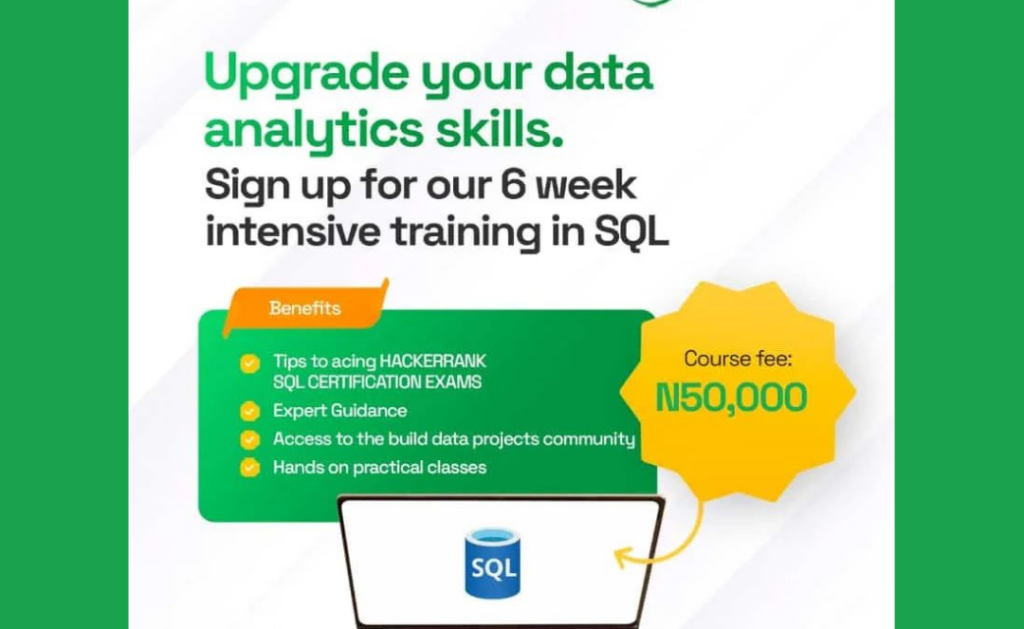
SQL For Intermediate Data Analysts — DAElites – The SQL Academy

This course covers the essentials of SQL for querying and managing databases. Expect to learn how to manipulate data efficiently, create complex queries, and manage relational database systems. By the end, you’ll have the skills to support data-driven decision-making processes in any organisation. 6 weeks intensive training FREE Global Hacker rank SQL Certification Exam Access

SQL For Intermediate Data Analysts — DAElites – The SQL Academy Read More »

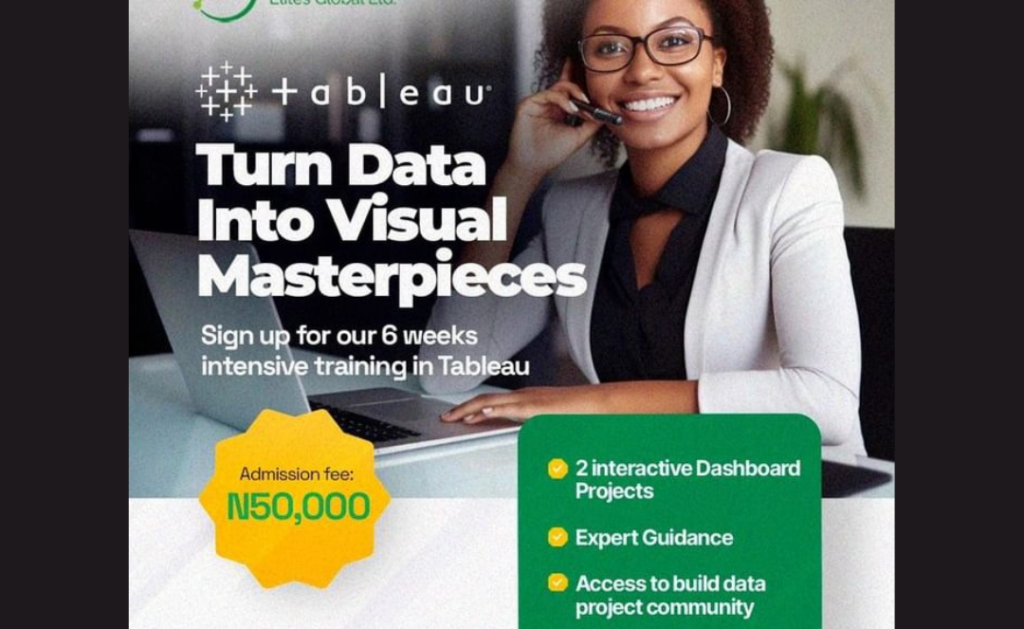
Tableau For Intermediate Data Analytics — DAElites – The Tableau Academy

Become proficient in Tableau with this course designed to teach you the art of data visualization. Learn to create dynamic dashboards, apply best practices in data visualization, and communicate data insights effectively. By the end, you’ll be able to build and share impactful visualizations that tell a compelling data story. 8 weeks intensive training Expert

Tableau For Intermediate Data Analytics — DAElites – The Tableau Academy Read More »

Power BI For Intermediate Data Analysts — DAElites – The Power BI Academy

This course will guide you through the powerful features of Power BI. Learn to create interactive dashboards and detailed reports using data modeling, DAX functions, and visual analytics. By the end, you’ll be able to convert complex datasets into compelling visual stories that drive business intelligence. 6 weeks intensive training Tips to acing Microsoft PL300

Power BI For Intermediate Data Analysts — DAElites – The Power BI Academy Read More »

Excel For Beginners in Data Analytics — DAElites – The Excel Academy

In this course, you will master Excel for advanced data analysis and visualisation. Expect to delve into complex functions, pivot tables, and data modelling techniques. By the end, you’ll be able to transform raw data into insightful reports and make data-driven decisions with confidence. Course Highlight 4 weeks intensive training Expert Guidance 2 interactive dashboard

Excel For Beginners in Data Analytics — DAElites – The Excel Academy Read More »

camanda_image

Power BI Data Analytics for Professionals [Personalised 1-on-1 Class]

At the end of this program, learners shall be able to demonstrate practical understanding of Excel for data management and Power BI for creating meaningful visualisations to drive business insights. The focus is on practical skills and their application in a business context. Participants gain practical experience through real-world case studies and projects, guided by industry experts, and receive certification upon completion, enhancing their professional profiles.

Power BI Data Analytics for Professionals [Personalised 1-on-1 Class] Read More »

Power BI for Beginners

Power BI for Beginners Who should enrol? Graduates. Excel Users. Data Users. Intermediate users ready to level up. Whether you’re a student, a professional, or someone seeking to improve your data visualisation skills, this beginner-friendly comprehensive program is designed just for you. Overview Microsoft Power BI is a powerful software tool that seamlessly connects to

Power BI for Beginners Read More »